PHOTO
Cairo – Madinet Masr, one of Egypt’s leading urban community developers, announced its consolidated financial results for the 3-month period ended 31 March 2025 (Q1 2025). Starting this quarter, the Company will report its consolidated financial results, including its subsidiaries operating across construction, real estate investments, and other related business lines. For the first quarter of the year, Madinet Masr reported a net profit of EGP 794.9 million on total revenue of EGP 2.6 billion, with contracted sales exceeding EGP 11.5 billion.
| Summary Income Statement (EGP mn) | Q1 2025 | Q1 2024 | Change |
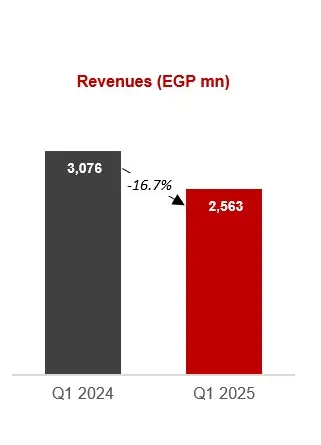
| Revenue | 2,562.7 | 3,076.3 | -16.7% |
| Gross Profit | 1,671.2 | 2,417.5 | -30.9% |
| Gross Profit Margin | 65.2% | 78.6% | -13.4 pts |
| EBITDA | 1,041.9 | 1,567.6 | -33.5% |
| EBITDA Margin | 40.7% | 51.0% | -10.3 pts |
| Net Profit | 794.9 | 1,179.1 | -32.6% |
| Net Profit Margin | 31.0% | 38.3% | -7.3 pts |
| Key Operational Indicators | Q1 2025 | Q1 2024 | Change |
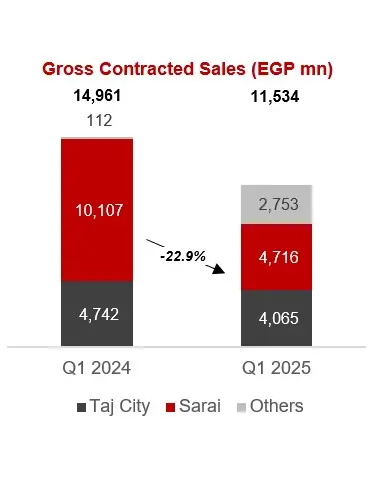
| Gross Contracted Sales (EGP mn) | 11,533.5 | 14,960.8 | -22.9% |
| Units Sold | 940 | 2,344 | -59.9% |
| Deliveries | 1,013 | 140 | 623.6% |
| Land Bank (million sqm) | 12.8 | 9.6 | 33.8% |
|
|
Key Highlights
- Madinet Masr booked gross contracted sales of EGP 11.5 billion for Q1 2025, down 22.9% year-on-year, amidst a real estate market correction period compared to record-highs last year.
- The Company increased its unit deliveries during Q1 2025 to 1,013 units, up 623.6% year-on-year from the 140 units delivered last year, a significant increase compared to the same period last year.
- Madinet Masr recorded total revenue of EGP 2.6 billion in Q1 2025, down 16.7% year-on-year, due to a decline of 23.4% in revenues from new sales compares to last year. This decline comes as the market normalizes from exceptional demand last year, when widespread economic uncertainty had fueled a sharp rise in real estate investments.
- Madinet Masr’s gross profit booked EGP 1.7 billion in Q1 2025, decreasing 30.9% year-on-year on the back of decreased revenues and higher operating costs. This quarter’s gross profit margin came at 65.2%, compared to 78.6% during the same period last year.
- Madinet Masr recorded an EBITDA of EGP 1.0 billion for Q1 2025, declining 33.5% year-on-year, yielding an EBITDA margin of 40.7%.
- Net profit stood at EGP 794.9 million for Q1 2025, declining 32.6% year-on-year in line with the overall decrease in the top line, with its associated margin normalizing to 31.0% for the quarter.
- On the balance sheet front, Madinet Masr closed Q1 2025 with a consolidated net debt position of EGP 675.3 million, an improvement of 19.2% in debt, compared to a consolidated net debt position of EGP 835.6 million at the end of FY 2024.
- Notes receivable recorded EGP 3.4 billion as of 31 March 2025, up from EGP 2.4 billion at year-end 2024, yielding a receivables/net debt ratio of (5.07) for Q1 2025 versus (2.92) at the close of FY 2024. Total accounts and notes receivable, including off-balance PDCs for undelivered units, amounted to EGP 66.1 billion as of 31 March 2025 compared to EGP 57.7 billion as of 31 December 2024.
- Cash collections increased by 1.7% year-on-year to EGP 3.4 billion in Q1 2025 from EGP 3.3 billion in Q1 2024, reflecting improved collection efficiency.
- Madinet Masr deployed EGP 1.5 billion in construction and infrastructure CAPEX in Q1 2025, up 44.5% from EGP 1.1 billion in Q1 2024, as the Company accelerated project execution and deliveries across its developments.
Management Comment
As we kick off the new year, I am pleased to present another strong set of financial and operational results, which showcase the resilience of our business model and the continued attractiveness of our value proposition. Our performance for the quarter in part reflects a high base effect resulting from exceptional sales during the comparable three-month period of last year, when widespread economic uncertainty had fueled a surge in real estate investment. Amidst a sector-wide normalization, we have successfully sustained our market position supported by a growing and increasingly diversified portfolio which continues to effectively cater to our customers’ evolving needs and tastes.
Diving deeper into this quarter’s performance, the key highlight for us was without a doubt the remarkable growth of 623.6% in unit deliveries, which surpassed the 1,000 units mark for the quarter. This noteworthy performance directly reflects a series of strategic initiatives undertaken over the past twelve months to boost construction and unit deliveries and capitalize on the robust demand for our developments. In line with this, CAPEX outlays for the period jumped 44.5% year-on-year to EGP 1.5 billion while our unrecognized revenues backlog continued to grow in Q1 2025, recording EGP 73.1 billion compared to EGP 64.9 billion this time last year. Despite the previously mentioned sector-wide normalization witnessed during the first three months of 2025, we reported encouraging financial results across the board, with margins remaining above our historical averages supported by a Company-wide strategy to optimize spending and boost operational efficiencies.
While navigating a fluid macroeconomic environment to deliver on our short-term targets, we also took meaningful steps towards our long term vision. During the quarter, we continued to invest in our innovative solutions for real estate ownership, maintenance, and facility management: Touba, Theqa, and SAFE. We take pride in being a leader in transformative real estate solutions in the Egyptian market, providing existing and potential customers with all-rounded solutions that cater to their diverse real estate needs. Our solutions place us at the forefront of Egypt’s innovative real estate landscape, aligning Madinet Masr with cutting-edge global technologies and emerging trends.
Heading into the summer months, we remain confident in our ability to grow our developments and deliver on our commitments. With a strong project pipeline, a diversified subsidiary base, and a proactive approach to market trends, Madinet Masr is well-positioned to sustain growth and generate long-term value for all of its stakeholders.
Abdallah Sallam
Chief Executive Officer
Operational Performance
Gross Contracted Sales
Madinet Masr’s gross contracted sales recorded EGP 11.5 billion during Q1 2025, decreasing 22.9% y-o-y from EGP 15.0 billion in Q1 2024. Approximately 40.9% (EGP 4.7 billion) of Madinet Masr’s gross contracted sales for Q1 2025 were recorded at Sarai, the Company’s 5.5-million-sqm mixed-use project near the New Administrative Capital on the Cairo-Suez Road. Meanwhile, 35.2% (EGP 4.1 billion) of Madinet Masr’s gross contracted sales for Q1 2025 were generated at Taj City, a 3.6-million-sqm mixed-use development in the eastern suburbs of Cairo. Other new projects generated a combined EGP 2.5 billion of gross contracted sales, while our subsidiaries Nasr Company for Civil Works and Minka recorded EGP 222.7 million in gross contracted sales representing 1.9% of the total gross contracted sales.
The Company sold a total of 940 units in Q1 2025, down 59.9% y-o-y from 2,344 units in Q1 2024 due to an exceptional increase in contract sales in Q1 2024. Madinet Masr sold 427 units at Taj City during the first quarter (Q1 2024: 713), 379 units at Sarai (Q1 2024: 1,626), and 134 units at Nasr Gardens (Q1 2024: 5).
Cash Collections
Madinet Masr made cash collections of EGP 3.4 billion for Q1 2025, an increase of 1.7% from the EGP 3.3 billion collected in Q1 2024. The Company recorded a cumulative delinquency rate of 1.6% at the end of Q1 2025, down from the rate of 2.0% reported for Q1 2024. The decline in the delinquency rate reflects successful efforts to purge the Company’s receivables portfolio of nonperforming contracts.
Cancellations
Cancellations stood at EGP 527.2 million for Q1 2025, up 1,123.1% y-o-y from EGP 43.1 million in Q1 2024, reflecting an increase of 430.0% in cancelled units. Cancellations as a percentage of gross contracted sales booked 4.6% during Q1 2025, up by 4.3 percentage points from 0.3% recorded in Q1 2024. The cancellation rate sits well below the normal range of 10-15%.
Deliveries
The Company delivered 1,013 units across its developments during Q1 2025, up 623.6% y-o-y from the 140 deliveries booked for Q1 2024. Unit deliveries have rebounded following increased investments in their completion over the past year. In Q1 2025, Madinet Masr completed 862 handovers at Sarai (Q1 2024: 74), 131 handovers at Taj City (Q1 2024: 38) and 20 handovers at Nasr Gardens (Q1 2024: 28), a subsidized housing project. Madinet Masr’s newer projects, such as The Butterfly and the New Heliopolis project, are still under way.

CAPEX
Madinet Masr deployed construction and infrastructure CAPEX of EGP 1.5 billion during Q1 2025 compared to EGP 1.1 billion in Q1 2024. The Company’s construction and infrastructure investments at Taj City amounted to EGP 741.6 million in Q1 2025, against EGP 545.8 million for Q1 2024. At Sarai, Madinet Masr recorded a construction and infrastructure CAPEX spend of EGP 567.2 million for Q1 2025, against EGP 373.7 million for Q1 2024. Construction and infrastructure CAPEX at New Heliopolis, The Butterfly, and other projects booked EGP 221.8 million for Q1 2025, collectively accounting for 14.5% of the total CAPEX outlay for Q1 2025.
Land Bank
Madinet Masr held a land bank measuring 12.8 million sqm at the close of Q1 2025. The Company’s primary land bank is strategically located in Greater Cairo (Taj City and Sarai) with new additions in Mostakbal City and New Heliopolis City. As at 31 March 2024, 43.0% of Madinet Masr’s land bank was held at Sarai, 28.4% at Taj City, 25.3% at newly launched developments, and 3.4% at Zahw Assiut.
Nearly 78.3% of Taj City’s land area was under development at the close of Q1 2025, with no residential land unlaunched. Commercial projects in Taj City accounted for the remaining 21.7% of unlaunched land. At Sarai, 67.0% of the total land area was under development by end of Q1 2025, with unlaunched residential projects and unlaunched nonresidential projects accounting for 18.3% and 14.7% of Sarai’s total land bank, respectively.
The Butterfly, a newly launched 998.9 thousand sqm project in Mostakbal City, was 91.1% under development at the close of Q1 2025, with unlaunched nonresidential land accounting for the remaining 8.9%. As of Q1 2025, 26.5% of Madinet Masr’s land bank in Assiut was under development, and 65.4% was unlaunched residential land, while the remaining 8.1% represented unlaunched non-residential land.
Madinet Masr’s newest partnerships, New Heliopolis and Zahraa El Maadi, remain fully unlaunched as at end of Q1 2025.
Financial Performance
Income Statement
Revenues
Madinet Masr’s revenues reached EGP 2.6 billion in Q1 2025, down by 16.7% y-o-y compared to EGP 3.1 billion in Q1 2024. Revenue slowdown for the Q1 2025 period was driven by an extraordinary surge during the same period last year significantly raising the base benchmark.
New sales generated the largest share of revenues in Q1 2025 totaling EGP 2.2 billion, down by 23.4% y-o-y and accounting for 83.6% of the Company’s Q1 2025 revenue of EGP 2.6 billion before cancellations, land sale, installment interest and rental revenue. Meanwhile, unit deliveries generated EGP 417.5 million in revenue during the same period, increasing by 107.1% y-o-y. Revenue from deliveries accounted for 16.1% of the Company’s revenue before cancellations, land sale, installment interest and rental revenue. At the close of Q1 2025, Madinet Masr had an unrecognized revenue backlog of EGP 73.1 billion calculated at the nominal price of undelivered sales.
Gross Profit
ross profit booked EGP 1.7 billion for Q1 2025, decreasing 30.9% y-o-y against EGP 2.4 billion during the same period last year. The decline in gross profit was due to the Company’s top-line performance for the period. Madinet Masr booked a gross profit margin of 65.2% in Q1 2025 compared to 78.6% in Q1 2024. The drop in the gross profit margin (GPM) during the period was due to the decrease in revenue from new sales while administrative expenses and other expenses decreased at a slower rate.
Sales, General & Administrative Expense
Sales, general & administrative (SG&A) expenses recorded EGP 607.7 million for Q1 2025, decreasing by 13.7% y-o-y from the EGP 704.1 million booked for Q1 2024. SG&A expenses declined on the back of decreased marketing activities. As a percentage of revenues, SG&A expense recorded 23.7% for Q1 2025, up by 0.8 percentage points from 22.9% the previous year.
Finance Cost
Finance cost booked EGP 158.9 million in Q1 2025, up by 14.4% from EGP 138.9 million for Q1 2024, reflecting the general increase in interest rates.
EBITDA
Madinet Masr booked an EBITDA of EGP 1.0 billion for Q1 2025, decreasing 33.5% y-o-y from EGP 1.6 billion in Q1 2024. The associated EBITDA margin was 40.7% in Q1 2025 compared to 51.0% in Q1 2024.
Net Profit
Net profit reached EGP 794.9 million for Q1 2025, declining 32.6% y-o-y from EGP 1.2 billion in Q1 2024. The net profit margin (NPM) recorded 31.0% for Q1 2025 compared to 38.3% in Q1 2024.
Balance Sheet
Net Cash & Short-term Investments
On the balance sheet front, Madinet Masr held net cash and short-term investments of EGP 4.0 billion as at 31 March 2025, up 12.7% from EGP 3.6 billion at the close of 2024, primarily due to increased cash collections.
Debt
As at 31 March 2025, Madinet Masr had outstanding debts of EGP 3.3 billion, up 22.5% from the EGP 2.7 billion booked at year-end of 2024. The increase comes on the back of a new bridge loan received from CIB. The Company’s debt/equity ratio stood at 0.31 as at 31 March 2025, slightly above the level of 0.28 posted at the close of 2024. The Company held a net debt position of EGP 675.3 million as at 31 March 2025, down from a net debt position of EGP 835.6 million at the close of 2024. Madinet Masr recorded a net debt/EBITDA ratio of (0.65) as at 31 March 2025, down from (0.53) as at 31 December 2024.
Notes Receivable
Madinet Masr held EGP 3.4 billion in notes receivable at the close of Q1 2025, of which EGP 2.1 billion were short-term receivables, EGP 1.3 billion long-term receivables. Total accounts and notes receivable as of 31 March 2025, including off-balance sheet PDCs for undelivered units amounted to EGP 66.1 billion compared to EGP 57.7 billion as of 31 December 2024. Receivables to net debt stood at (5.07) by the end of Q1 2025, compared to (2.92) recorded at year-end 2024.
PP&E
PP&E, fixed assets under construction, and property investments booked EGP 1,879.3 million at the close of Q1 2025, up marginally by 0.6% from the EGP 1,868.2 million booked at the close of 2024.
Recent Corporate Developments
In January 2025, Madinet Masr inked a memorandum of understanding (MoU) with Korra Energi to accelerate construction work at Taj City, with investments exceeding EGP 480 million.
In January 2025, Madinet Masr has entered a strategic partnership with GTCI Constructors for Energy and Infrastructure Projects, a subsidiary of Al Tawakol Group, to invest more than EGP 263 million in advancing the infrastructure of Taj City.
During Q1 2025, Madinet Masr bought 29.8 million treasury stocks at a total cost of EGP 128.4 million, at an average price of 4.3 EGP per share.
-Ends-
| Income Statement
Balance Sheet
|
About Madinet Masr
Madinet Masr, one of Egypt’s leading urban community developers was established in 1959. Headquartered in Cairo and listed on the Egyptian Stock Exchange (EGX) in 1996, Madinet Masr operates under a robust corporate governance structure and is committed to delivering exceptional value to all its stakeholders. Rebranded from Madinet Nasr to Madinet Masr in 2023, the company has become one of the most innovative real estate companies in Egypt, capitalizing on a long and successful track record of delivering distinguished and multi-functional developments that drives growth in Egypt by developing sustainable communities. Madinet Masr has become a prominent community developer and urban planner in Egypt after developing Nasr City, the largest neighborhood in Greater Cairo with a population of over three million people. Since then, it has actively taken on large-scale projects to transform sizeable areas of land into contemporary, integrated communities.
Today, Madinet Masr owns a land portfolio of 12.8 million sqm, with two renowned mega developments, Taj City and Sarai in East Cairo. Taj City, a 3.6 million sqm mixed use development positioned as a premier destination, and Sarai a 5.5 million sqm mixed use development strategically located in front of Egypt’s New Administrative Capital. Madinet Masr has launched Zahw in 2023, its first expansion project outside of Cairo Governorate. Zahw is a 104-acre mixed use development strategically positioned west of Assiut Governorate beside Assiut’s airport and 15-minutes away from its center. Zahw compliments the contemporary real estate products in Upper Egypt.
Some of the key strategic partnerships signed include the development of a project in New Heliopolis City, covering an area of 491 feddans, and the development of an integrated residential urban project in the fourth phase of Al Amal Axis in Mostakbal City, covering an area of 238 feddans (approximately 1 million square meters).
Shareholding Structure and Contact Information

Investor Relations Contact
Ahmed Khalil
akhalil@madinetmasr.com
Investor Relations Department
investor.relations@madinetmasr.com
Madinet Masr
4 Youssif Abbas Street, District 2
Nasr City, Cairo, Egypt
www.madinetmasr.com
Disclaimer
The information, statements and opinions contained in this Presentation do not constitute a public offer under any applicable legislation or an offer to sell or solicitation of any offer to buy any securities or financial instruments or any advice or recommendation with respect to such securities or other financial instruments. Information in this Presentation relating to the price at which investments have been bought or sold in the past, or the yield on such investments, cannot be relied upon as a guide to the future performance of such investments. This Presentation contains forward-looking statements. Such forward-looking statements contain known and unknown risks, uncertainties and other important factors, which may cause actual results, performance or achievements of Madinet Masr (the "Company") to be materially different from any future results, performance or achievements expressed or implied by such forward-looking statements. Forward-looking statements are based on numerous assumptions regarding the Company's present and future business strategies and the environment in which the Company will operate in the future. None of the future projections, expectations, estimates or prospects in this Presentation should be taken as forecasts or promises nor should they be taken as implying any indication, assurance or guarantee that the assumptions on which such future projections, expectations, estimates or prospects are based are accurate or exhaustive or, in the case of the assumptions, entirely covered in the Presentation. These forward-looking statements speak only as of the date they are made and, subject to compliance with applicable law and regulation, the Company expressly disclaims any obligation or undertaking to disseminate any updates or revisions to any forward-looking statements contained in the Presentation to reflect actual results, changes in assumptions or changes in factors affecting those statements. The information and opinions contained in this Presentation are provided as of the date of the Presentation, are based on general information gathered at such date and are subject to changes without notice. The Company relies on information obtained from sources believed to be reliable but does not guarantee its accuracy or completeness. Subject to compliance with applicable law and regulation, neither the Company, nor any of its respective agents, employees or advisers intends or has any duty or obligation to provide the recipient with access to any additional information, to amend, update or revise this Presentation or any information contained in the Presentation. Certain financial information contained in this presentation has been extracted from the Company's unaudited management accounts and financial statements. The areas in which management accounts might differ from International Financial Reporting Standards and/or U.S. generally accepted accounting principles could be significant and you should consult your own professional advisors and/or conduct your own due diligence for complete and detailed understanding of such differences and any implications they might have on the relevant financial information contained in this presentation. Some numerical figures included in this Presentation have been subject to rounding adjustments. Accordingly, numerical figures shown as totals in certain tables might not be an arithmetic aggregation of the figures that preceded them.