(Geneva) - The International Air Transport Association (IATA) released data for global air freight markets in June showing improvement, but at a slower pace than some of the traditional leading indicators would suggest.
- Global demand, measured in cargo tonne-kilometers (CTKs*), fell by 17.6% in June (-19.9% for international operations) compared to the previous year. That is a modest improvement from the 20.1% year-on-year drop recorded in May.
- Global capacity, measured in available cargo tonne-kilometers (ACTKs), shrank by 34.1% in June (‑33.9% for international operations) compared to the previous year. This was on par with the 34.8% year-on-year drop in May.
- Belly capacity for international air cargo shrank by 70% in June compared to the previous year due to the withdrawal of passenger services amid COVID-19. This was partially offset by a 32% increase in capacity through expanded use of freighter aircraft.
- Global manufacturing demand stabilized in June:
- The new export orders component of the Purchasing Managers Index (PMI) rose by 11 points compared to May, the strongest monthly increase since the series began in 1999.
- The PMI tracking global manufacturing output rebounded in June to its highest level since January.
“Cargo is, by far, healthier than the passenger markets but doing business remains exceptionally challenging. While economic activity is re-starting after major lockdown disruptions there has not been a major boost in demand. The rush to get personal protective equipment (PPE) to market has subsided as supply chains regularized, enabling shippers to use cheaper sea and rail options. And the capacity crunch continues because passenger operations are recovering very slowly,” said Alexandre de Juniac, IATA's Director General and CEO.
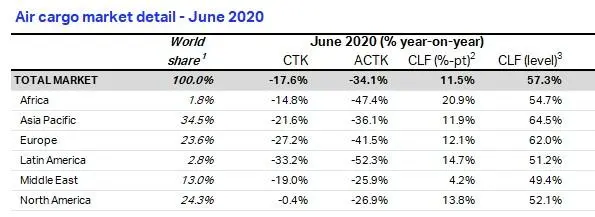
1% of industry CTKs in 2019 2Year-on-year change in load factor 3Load factor level
June Regional Performance
All regions recorded declines in June. Airlines in Europe and Latin America suffered the sharpest drops in year-on-year growth in total air freight volumes, while airlines in Asia-Pacific and the Middle East experienced slightly less dramatic declines. Airlines in North America and Africa saw more moderate drops compared to the other regions.
Asia-Pacific airlines saw demand for international air cargo fall by 20% in June 2020 compared to the same period a year earlier. This was a slight deterioration over the 18.8% drop in May. Despite manufacturing starting to pick up in the region, demand was impacted by the reduction in shipments of PPE by air. International capacity decreased 32.3%.
North American carriers reported a single digit fall in international cargo demand of 8.8% year-on-year in June. This was the smallest contraction of all regions. The resilient performance is due to the large freighter fleets of a few of the region’s airlines as well as the fiscal support to airlines in the USA from the CARES Act. International capacity decreased 30.7%.
European carriers reported a 27.6% annual drop in international cargo volumes in June. This was a slight improvement from May’s performance of -29.5% but still the second weakest performance of all regions. International capacity decreased 40.7%
Middle Eastern carriers reported a decline of 19.1% year-on-year in June, an improvement from the 24.9% fall in May. International capacity decreased 25.8%, the best of all regions. This was driven by the aggressive operational strategies of some of the region’s carriers.
Latin American carriers posted a 29.4% drop in year-on-year international demand in June. This was the weakest performance of all regions. International capacity decreased 43.6% indicating a sizeable capacity crunch. The COVID-19 crisis is particularly challenging at present for airlines based in Latin America owing to strict lockdown measures.
African airlines posted a contraction of 13.8% in June. This was a weaker performance than the 7.3% fall in demand in May. The small Africa-Asia market continued to grow in June up 20.1%. However, the region suffered from the effects of the pandemic becoming more severe in June. International capacity in this region decreased 46.2%.
-Ends-
For more information, please contact:
Corporate Communications
Tel: +41 22 770 2967
Email: corpcomms@iata.org
- Please note that as of January 2020 onwards, we have clarified the terminology of the Industry and Regional series from ‘Freight’ to ‘Cargo’, the corresponding metrics being FTK (changed to ‘CTK’), AFTK (changed to ‘ACTK’), and FLF (changed to ‘CLF’), in order to reflect that the series have been consisting of Cargo (Freight plus Mail) rather than Freight only. The data series themselves have not been changed.
- IATA (International Air Transport Association) represents some 290 airlines comprising 82% of global air traffic.
- You can follow us at twitter.com/iata for announcements, policy positions, and other useful industry information.
- Explanation of measurement terms:
- CTK: cargo tonne-kilometers measures actual cargo traffic
- ACTK: available cargo tonne-kilometers measures available total cargo capacity
- CLF: cargo load factor is % of ACTKs used
- IATA statistics cover international and domestic scheduled air cargo for IATA member and non-member airlines.
- Total cargo traffic market shares by region of carriers in terms of CTK are: Asia-Pacific 34.5%, Europe 23.6%, North America 24.3%, Middle East 13.0%, Latin America 2.8%, and Africa 1.8%.
© Press Release 2020
Disclaimer: The contents of this press release was provided from an external third party provider. This website is not responsible for, and does not control, such external content. This content is provided on an “as is” and “as available” basis and has not been edited in any way. Neither this website nor our affiliates guarantee the accuracy of or endorse the views or opinions expressed in this press release.
The press release is provided for informational purposes only. The content does not provide tax, legal or investment advice or opinion regarding the suitability, value or profitability of any particular security, portfolio or investment strategy. Neither this website nor our affiliates shall be liable for any errors or inaccuracies in the content, or for any actions taken by you in reliance thereon. You expressly agree that your use of the information within this article is at your sole risk.
To the fullest extent permitted by applicable law, this website, its parent company, its subsidiaries, its affiliates and the respective shareholders, directors, officers, employees, agents, advertisers, content providers and licensors will not be liable (jointly or severally) to you for any direct, indirect, consequential, special, incidental, punitive or exemplary damages, including without limitation, lost profits, lost savings and lost revenues, whether in negligence, tort, contract or any other theory of liability, even if the parties have been advised of the possibility or could have foreseen any such damages.