(Geneva) - The International Air Transport Association (IATA) announced that the recovery in passenger demand which had been slowing since the Northern hemisphere’s summer travel season, came to a halt in November 2020.
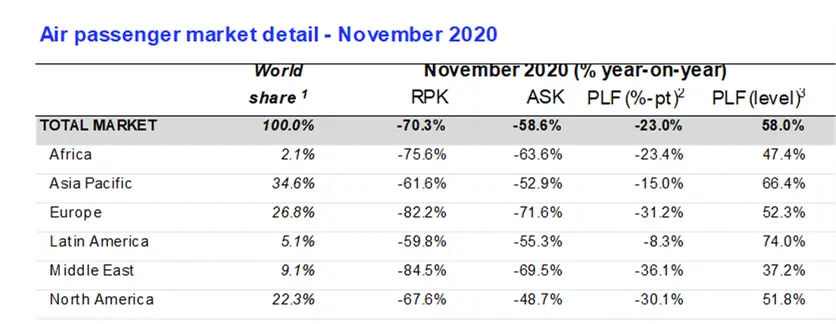
- Total demand (measured in revenue passenger kilometers or RPKs) was down 70.3% compared to November 2019, virtually unchanged from the 70.6% year-to-year decline recorded in October. November capacity was 58.6% below previous year levels and load factor fell 23.0 percentage points to 58.0%, which was a record low for the month.
- International passenger demand in November was 88.3% below November 2019, slightly worse than the 87.6% year-to-year decline recorded in October. Capacity fell 77.4% below previous year levels, and load factor dropped 38.7 percentage points to 41.5%. Europe was the main driver of the weakness as new lockdowns weighed on travel demand.
- Recovery in domestic demand, which had been the relative bright spot, also stalled, with November domestic traffic down 41.0% compared to the prior year (it stood at 41.1% below the previous year’s level in October). Capacity was 27.1% down on 2019 levels and the load factor dropped 15.7 percentage points to 66.6%.
“The already tepid recovery in air travel demand came to a full stop in November. That’s because governments responded to new outbreaks with even more severe travel restrictions and quarantine measures. This is clearly inefficient. Such measures increase hardship for millions. Vaccines offer the long-term solution. In the meantime, testing is the best way that we see to stop the spread of the virus and start the economic recovery. How much more anguish do people need to go through—job losses, mental stress—before governments will understand that?” said Alexandre de Juniac, IATA’s Director General and CEO.
International Passenger Markets
Asia-Pacific airlines’ November traffic plunged 95.0% compared to the year-ago period, which was barely changed from the 95.3% decline in October. The region continued to suffer from the steepest traffic declines for a fifth consecutive month. Capacity dropped 87.4% and load factor sank 48.4 percentage points to 31.6%, the lowest among regions.
European carriers saw an 87.0% decline in traffic in November versus a year ago, worsened from an 83% decline in October. Capacity withered 76.5% and load factor fell by 37.4 percentage points to 46.6%.
Middle Eastern airlines’ demand plummeted 86.0% in November year-to-year, which was improved from an 86.9% demand drop in October. Capacity fell 71.0%, and load factor declined 37.9 percentage points to 35.3%.
North American carriers had an 83.0% traffic drop in November, versus an 87.8% decline in October. Capacity dived 66.1%, and load factor dropped 40.5 percentage points to 40.8%.
Latin American airlines experienced a 78.6% demand drop in November, compared to the same month last year, improved from an 86.1% decline in October year-to-year. This was the strongest improvement of any region. Routes to/from Central America were the most resilient as governments reduced travel restrictions—especially quarantine requirements. November capacity was 72.0% down and load factor dropped 19.5 percentage points to 62.7%, highest by far among the regions, for a second consecutive month.
African airlines’ traffic sank 76.7% in November, little changed from a 77.2% drop in October, but the best performance among the regions. Capacity contracted 63.7%, and load factor fell 25.2 percentage points to 45.2%.
Domestic Passenger Markets
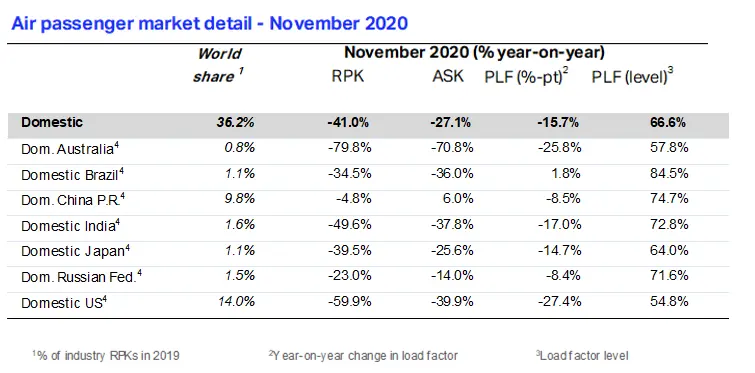
Australia’s domestic traffic was down 79.8% in November compared to November a year ago, improved from an 84.4% decline in October, as certain states opened up. But it continued to significantly lag other domestic markets.
India’s domestic traffic fell 49.6% in November, an improvement over a 55.6% decline in October, with more improvement expected as more businesses reopen.
View the November Air Passenger Market Analysis (pdf)
-Ends-
For more information, please contact:
Four Communications
Email: iata@fourcommunications.com
Notes for Editors:
- IATA (International Air Transport Association) represents some 290 airlines comprising 82% of global air traffic.
- You can follow us at https://twitter.com/iata for announcements, policy positions, and other useful industry information.
- Statistics compiled by IATA Economics using direct airline reporting complemented by estimates, including the use of FlightRadar24 data provided under license.
- All figures are provisional and represent total reporting at time of publication plus estimates for missing data. Historic figures are subject to revision.
- Domestic RPKs accounted for about 36% of the total market. It is most important for North American airlines as it is about 66% of their operations.
- Explanation of measurement terms:
- RPK: Revenue Passenger Kilometers measures actual passenger traffic
- ASK: Available Seat Kilometers measures available passenger capacity
- PLF: Passenger Load Factor is % of ASKs used.
- IATA statistics cover international and domestic scheduled air traffic for IATA member and non-member airlines.
- In 2019, total passenger traffic market shares by region of carriers in terms of RPK are: Asia-Pacific 34.6%, Europe 26.8%, North America 22.3%, Middle East 9.1%, Latin America 5.1%, and Africa 2.1%.
© Press Release 2021
Disclaimer: The contents of this press release was provided from an external third party provider. This website is not responsible for, and does not control, such external content. This content is provided on an “as is” and “as available” basis and has not been edited in any way. Neither this website nor our affiliates guarantee the accuracy of or endorse the views or opinions expressed in this press release.
The press release is provided for informational purposes only. The content does not provide tax, legal or investment advice or opinion regarding the suitability, value or profitability of any particular security, portfolio or investment strategy. Neither this website nor our affiliates shall be liable for any errors or inaccuracies in the content, or for any actions taken by you in reliance thereon. You expressly agree that your use of the information within this article is at your sole risk.
To the fullest extent permitted by applicable law, this website, its parent company, its subsidiaries, its affiliates and the respective shareholders, directors, officers, employees, agents, advertisers, content providers and licensors will not be liable (jointly or severally) to you for any direct, indirect, consequential, special, incidental, punitive or exemplary damages, including without limitation, lost profits, lost savings and lost revenues, whether in negligence, tort, contract or any other theory of liability, even if the parties have been advised of the possibility or could have foreseen any such damages.