PHOTO
The total value of investment banking fees earned in the Middle East and North Africa (MENA) so far this year has decreased by 17 percent year-on-year, according to data from Thomson Reuters.
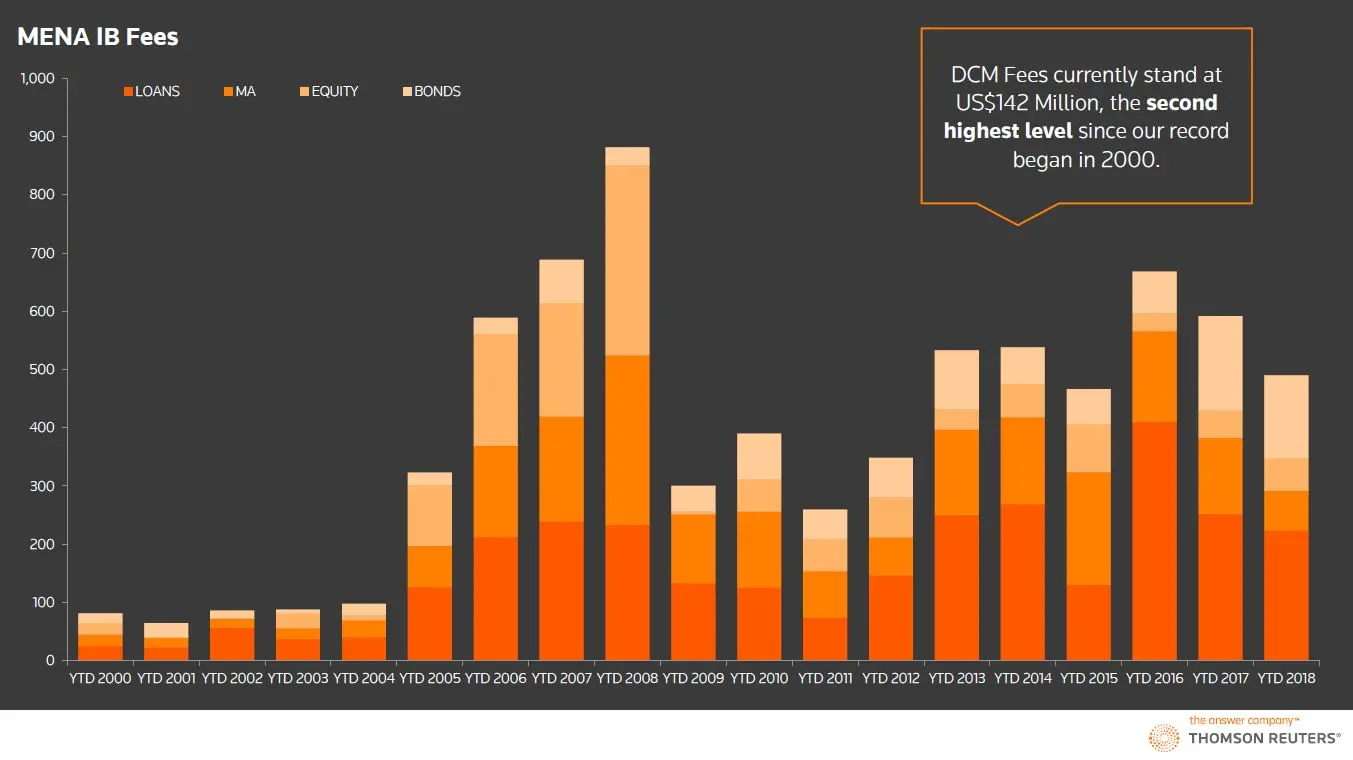
A report, compiled by Thomson Reuters Deals Intelligence, found the only asset class to see growth in fees so far this year was equity capital markets, which increased 21 percent. (Read the full report here).
Investment banking fees overall across the MENA region amounted to $490 million so far for the year to date (27th July 2018). This was down from $592 million and $668 million over the same periods in 2017 and 2016, respectively. It compares to a high of $882 million over the same period in 2008 and a low of $259 million in 2011, the report showed.
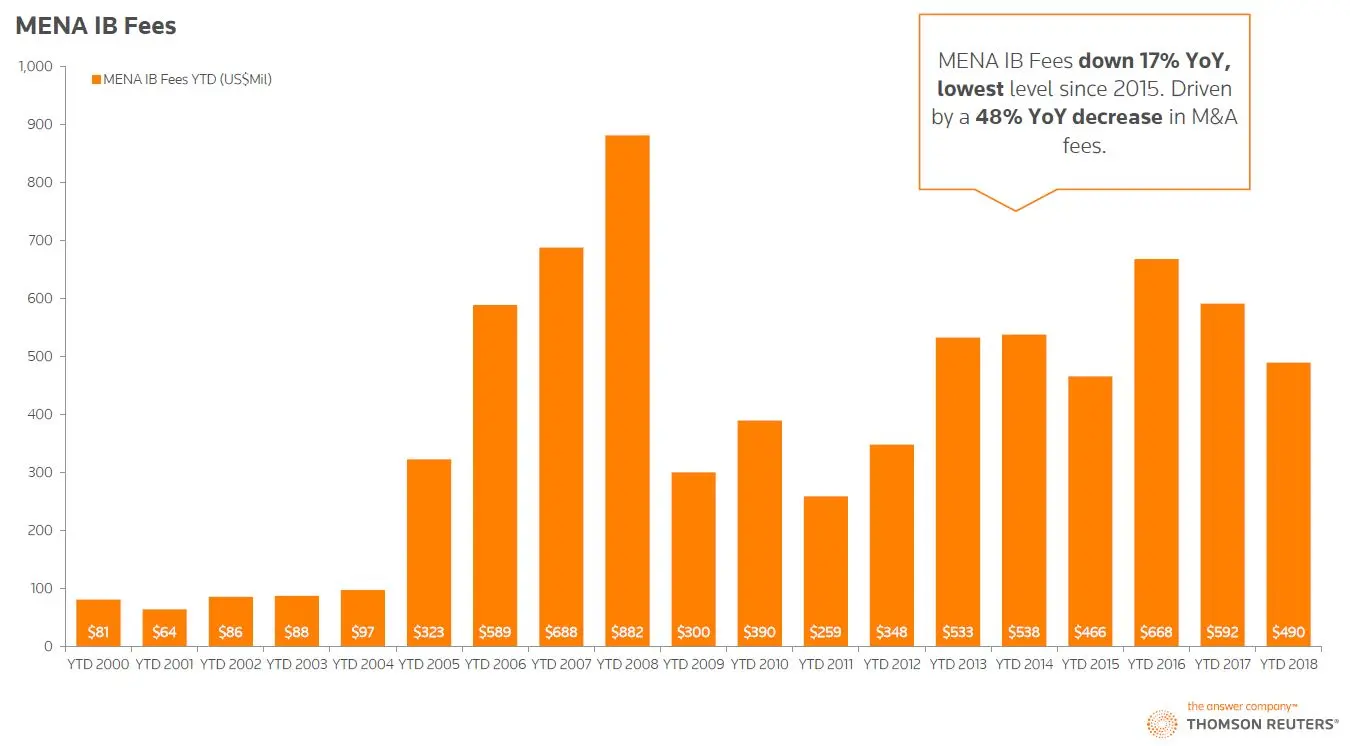
The volume of investment banking fees paid fell by 17 percent from 2017 to 2018, reaching the lowest level since 2015. The asset class which saw the largest decrease was mergers and acquisition (M&A) which fell by 48 percent.
The latest Deals Intelligence data, which represents M&A fees paid by companies based in MENA, was in contrast to global M&A data relating to deals with regional involvement, which hit an eight-year high, according to an earlier Thomson Reuters report published last month. (Read more here).
The data also showed that Qatar so far leads the way for bond fees in 2018, recording the highest fee volume from the country since 2000, according to Gonzalo Ponce Pestana, analyst, Thomson Reuters Deals Intelligence, who compiled the report.
In the bonds or debt capital market (DCM) sector, fee levels are at the second highest recorded point since 2000, standing at $142 million, with the United Arab Emirates, Qatar and Oman presenting the higher volumes of fees for MENA so far this year.
“It is Qatar DCM issuance that acts as the main driver, going from $11.12 million (year-to-date) 2017, to $44.48 million so far,” Pestana told Zawya in an email interview earlier this week.
In addition, Oman showed a 22 percent increase year-on-year, to an estimated range of $21-25million, while the UAE showed only a 2.2 percent increase to an estimated range of $35-39 million, he said. In 2018, 57.6 percent of the region’s DCM fees so far have come from the UAE and Qatar, up from 29 percent at this time last year.
When it comes to individual banks, Standard Chartered plc topped the MENA rankings so far this year, with $24.25 million for the year-to-date, taking 17.1 percent of the market share. The remainder of the top five were HSBC Holdings PLC ($12.17 million in fees), Deutsche Bank ($10.9 million), Citi ($9.94 million) and JP Morgan ($7.58 million).
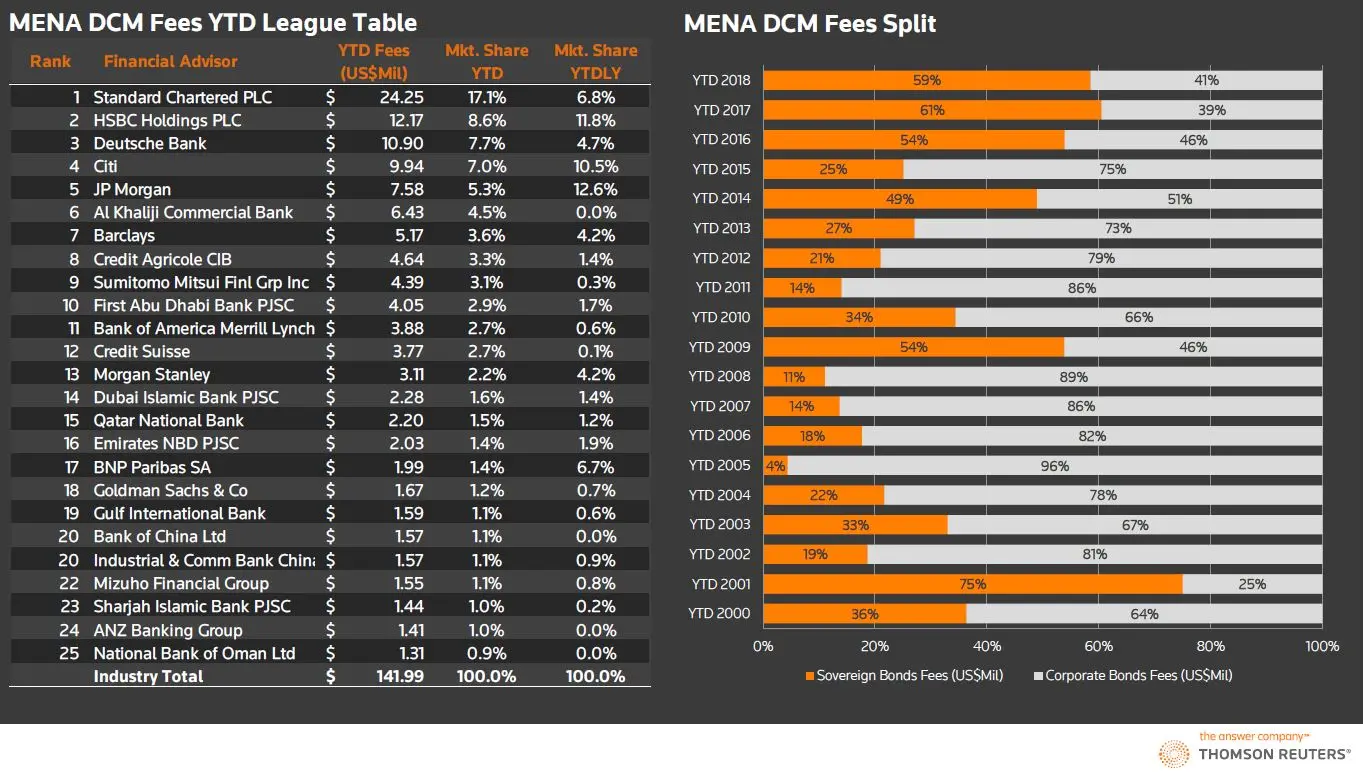
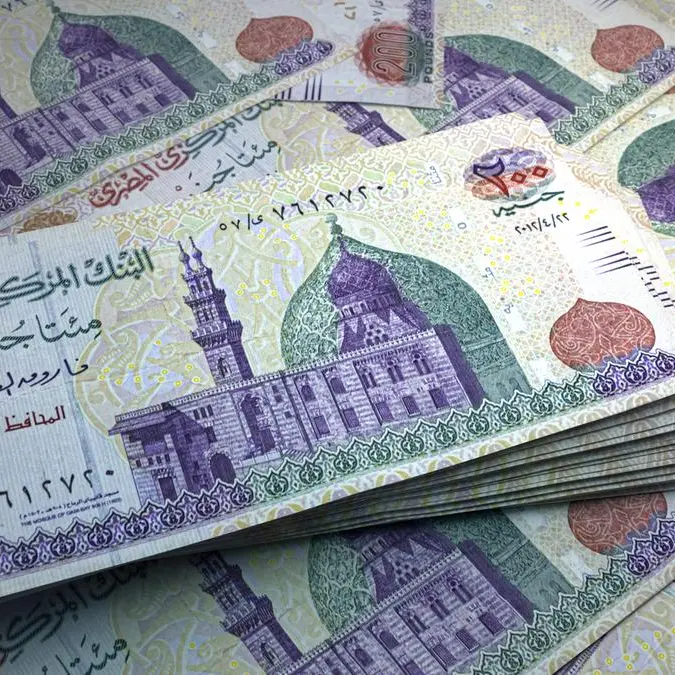
Another area in which Qatar has led the way in 2018 is in sovereign bond fees, with the country accounting for $30 million in fees in 2018, up from zero fees in 2017.
In 2017, however it was Egypt that led the way, presenting $24.6 million in sovereign bond fees. The UAE, Saudi Arabia, Oman and Kuwait all contributed with more than $12 million each in debt capital market fees.
From a corporate bond perspective, the UAE has been the biggest contributor in 11 out of 19 years since 2000 and currently leads in 2018 with $26 million in fees. However, it only presented $7.6million in fees during the same period of 2016, explaining the lower volumes during that period, according to Pestana.
Further reading:
• Global investment banking fees at record high in 2017 - Thomson Reuters data
• Investment banking fees at record high in 2017 - Thomson Reuters data
• Credit where its due Gulf's sovereign bond market could be next for ratings upgrade
• Splashing the cash: Bankers fees boosted by debt markets
• Capital markets off to a flying start in 2018
• Click here to read a full pdf of the latest Deals Intelligence data
Reporting by Imogen Lillywhite, editing by Shane McGinley
(imogen.lillywhite@thomsonreuters.com)
Click here to read a full pdf of the latest Deals Intelligence data
Our Standards: The Thomson Reuters Trust Principles
Disclaimer: This article is provided for informational purposes only. The content does not provide tax, legal or investment advice or opinion regarding the suitability, value or profitability of any particular security, portfolio or investment strategy. Read our full disclaimer policy here.
© ZAWYA 2018