(Geneva) - The International Air Transport Association (IATA) announced that passenger demand in May (measured in revenue passenger kilometers or RPKs), dropped 91.3% compared to May 2019. This was a mild uptick from the 94% annual decline recorded in April 2020. The improvement was driven by recovery in some domestic markets, most notably China.
“May was not quite as terrible as April. That’s about the best thing that can be said. As predicted, the first improvements in passenger demand are occurring in domestic markets. International traffic remained virtually stopped in May. We are only at the very beginning of a long and difficult recovery. And there is tremendous uncertainty about what impact a resurgence of new COVID-19 cases in key markets could have,” said Alexandre de Juniac, IATA’s Director General and CEO.
International Passenger Markets
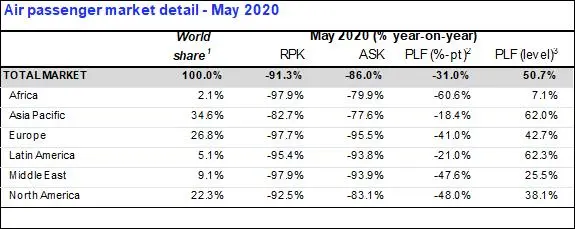
May international passenger demand fell 98.3% compared to May 2019, which was virtually unchanged from the 98.4% decline recorded in April. Capacity plummeted 95.3%, and load factor sank 51.9 percentage points to 28.6% meaning a bit more than a quarter of seats were filled, on average.
European carriers’ May demand contracted 98.7% compared to last year, virtually unchanged from a 98.9% drop in April, year-over-year, and the worst decline among regions. Capacity dropped 97.5% and load factor fell by 41.7 percentage points to 42.4%.
Asia-Pacific airlines’ May traffic plunged 98.0% compared to the year-ago period, also in line with a 98.2% recorded in April. Capacity fell 95.1% and load factor shrank 46.6 percentage points to 32.1%.
Middle Eastern airlines posted a 98.0% traffic contraction for May, compared with a 97.3% demand drop in April. Capacity tumbled 93.9%, and load factor sagged to 23.9%, down 49.1 percentage points compared to the year ago period.
North American carriers had a 98.2% traffic decline in May, little changed from a 98.4% decline in April. Capacity fell 94.5%, and load factor dropped 56.7 percentage points to 27.2%.
Latin American airlines experienced a 98.1% demand drop in May compared to the same month last year, versus a 98.2% drop in April. Capacity fell 96.6% and load factor fell 38.1 percentage points to 45.9%, best among the regions.
African airlines’ traffic sank 98.2% in May, fractionally improved from a 98.7% decline in April. Capacity contracted 77.8%, which was the smallest supply reduction among the regions, and load factor dived 61.8 percentage points to just 5.3% of seats filled, which was the lowest among regions.
Domestic Passenger Markets
Domestic traffic fell 79.2% in May. This was an improvement compared to an 86.2% decline in April. Domestic capacity fell 69.2% and load factor dropped 27.2 percentage points to 56.9%.
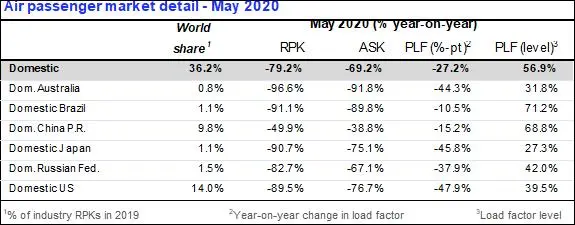
China’s carriers posted a 49.9% year-on-year decline in traffic in May, significantly improved from the 64.6% demand drop recorded in April. However, the improvement has been more recently interrupted by flight cancellations to and from Beijing amid an increase in the number of new infections in the city
US airlines’ domestic traffic was down 89.5% in May, an improvement over the 95.6% decline experienced in April. However, the recent rise in infection rates in key US states following the lifting of lockdown restrictions could negatively impact the budding recovery.
The Bottom Line
“We appear to be in the very early stages of a recovery in air travel. But the situation is fragile. We need governments to support and strengthen the restart by quickly implementing the International Civil Aviation Organization’s (ICAO’s) global guidelines for restoring air connectivity contained in ICAO’s Takeoff: Guidance for Air Travel through the COVID-19 Public Health Crisis.
“Governments also need to avoid adding blockers to the recovery, such as implementing entry quarantines. They have the same impact as outright travel bans and will keep economies closed down to the benefits of aviation connectivity. Governments should also avoid new fees and charges to cover the cost of COVID-19 related health measures (such as testing and contact tracing), which will make travel less accessible. Travel and tourism accounts for 10.3% of global GDP and 300 million jobs. It is in everybody’s interest, including governments, to remove barriers to travel as soon as it is safe to do so. And in the process, it is critical that governments don’t stall the fragile recovery by introducing new regulatory or cost barriers to travel,” said de Juniac.
-Ends-
View the full May Air Passenger Market Analysis
View the COVID-19 'Air travel turns up but outlook uncertain' presentation
For more information, please contact:
Four Communications
Tel: +971 55 194 3367
Email: iata@fourcommunications.com
- IATA (International Air Transport Association) represents some 290 airlines comprising 82% of global air traffic.
- You can follow us at https://twitter.com/iata for announcements, policy positions, and other useful industry information.
- Statistics compiled by IATA Economics using direct airline reporting complemented by estimates, including the use of FlightRadar24 data provided under license.
- All figures are provisional and represent total reporting at time of publication plus estimates for missing data. Historic figures are subject to revision.
- Domestic RPKs accounted for about 36% of the total market. It is most important for North American airlines as it is about 66% of their operations.
- Explanation of measurement terms:
- RPK: Revenue Passenger Kilometers measures actual passenger traffic
- ASK: Available Seat Kilometers measures available passenger capacity
- PLF: Passenger Load Factor is % of ASKs used.
- IATA statistics cover international and domestic scheduled air traffic for IATA member and non-member airlines.
- Total passenger traffic market shares by region of carriers in terms of RPK are: Asia-Pacific 34.6%, Europe 26.8%, North America 22.3%, Middle East 9.1%, Latin America 5.1%, and Africa 2.1%.
© Press Release 2020
Disclaimer: The contents of this press release was provided from an external third party provider. This website is not responsible for, and does not control, such external content. This content is provided on an “as is” and “as available” basis and has not been edited in any way. Neither this website nor our affiliates guarantee the accuracy of or endorse the views or opinions expressed in this press release.
The press release is provided for informational purposes only. The content does not provide tax, legal or investment advice or opinion regarding the suitability, value or profitability of any particular security, portfolio or investment strategy. Neither this website nor our affiliates shall be liable for any errors or inaccuracies in the content, or for any actions taken by you in reliance thereon. You expressly agree that your use of the information within this article is at your sole risk.
To the fullest extent permitted by applicable law, this website, its parent company, its subsidiaries, its affiliates and the respective shareholders, directors, officers, employees, agents, advertisers, content providers and licensors will not be liable (jointly or severally) to you for any direct, indirect, consequential, special, incidental, punitive or exemplary damages, including without limitation, lost profits, lost savings and lost revenues, whether in negligence, tort, contract or any other theory of liability, even if the parties have been advised of the possibility or could have foreseen any such damages.