China's middle class ranks the largest in the world with 109 million members.
Saudi Arabia and UAE expected to see a significant growth in the number of millionaires in the next five years
Dubai - The Credit Suisse Research Institute today released its sixth annual Global Wealth Report, which focuses on how the middle class has developed since the turn of the century. It finds that the size and wealth of the middle class globally grew quickly before the financial crisis, but growth subsided after 2007 and rising inequality has squeezed its share of wealth in every region. In its analysis, Credit Suisse has taken a new approach to defining the middle class category, using a wealth-based definition - versus an income-based one - that allows for adjustments over time to reflect inflation, and also varies across countries depending on local purchasing power.
Additional key findings of the report include:
− Global wealth fell by USD 13 trillion from mid-2014 to mid-2015, due to dollar appreciation. If measured at constant exchange rates, global wealth would have risen by USD 13 trillion since last year.
− The USA again led the world with a substantial rise in household wealth of USD 4.6 trillion. China also posted a large annual rise of USD 1.5 trillion.
− China now has the largest middle class with 109 million members, surpassing the USA with 92 million.
− Wealth per adult fell by 6.2% to USD 52,400 and is now back below the level of 2013.
− Switzerland again ranked highest in average wealth, but fell USD 24,800 to USD 567,100 per adult.
− A person needs just USD 3,210 (after debts) to be in the wealthiest half of the world.
− Wealth inequality has continued to increase since 2008, with the top percentile of wealth holders now owning 50.4% of all household wealth.
− The top 1% of wealth holders now owns half of all household wealth.
− Global wealth could reach USD 345 trillion by mid-2020, 38% above its mid-2015 level, according to Credit Suisse estimates.
− The number of dollar millionaires worldwide could increase by 46% in the next five years, reaching 49.3 million by mid-2020.
Michael O'Sullivan, Chief Investment Officer for the UK & EEMEA, Private Banking and Wealth Management at Credit Suisse said, "We are clearly in a growth industry, with wealth set to continue its upward trajectory. By our estimates, wealth could grow at an annual rate of 6.6%, reaching USD 345 trillion in 2020. Furthermore, the number of dollar millionaires could exceed 49.3 million adults in 2020, a rise of more than 46.2%, with China likely to see the largest percentage increase, and Africa as the next performing region. Overall, emerging markets account for 6.5% of millionaires and will see their share rise to 7.4% by the end of the decade. High-income economies will still account for the bulk of new millionaires, with 14.0 million adults entering this category. Millionaire net wealth is likely to rise by 8.4% annually, as more people enter this segment. Emerging markets will likely account for 9.1% of millionaire wealth in 2020, 1% above current levels."
Credit Suisse Research Institute's Markus Stierli said: "From 2008 onwards, wealth growth has not allowed middle-class numbers to keep pace with population growth in the developing world. Furthermore, the distribution of wealth gains has shifted in favor of those at higher wealth levels. These two factors have combined to produce a decline in the share of middle-class wealth."
Credit Suisse provides the most comprehensive and reliable source of information available on global household wealth. This analysis comprises the wealth holdings of 4.8 billion adults across more than 200 countries - from billionaires in the top echelon to the middle and bottom sections of the "wealth pyramid" - which other studies often overlook. The methodology is robust, established over many years of analysis, and completely transparent with regard to the underlying sources and their quality.
For a copy of the Credit Suisse Research Institute report, "Global Wealth Report 2015," please visit the dedicated website: https://www.credit-suisse.com/gwr. Full information on sources and methodology is also provided in the Global Wealth Databook 2015.
Highlights of the Global Wealth Report 2015
Changes in wealth from 2014-2015
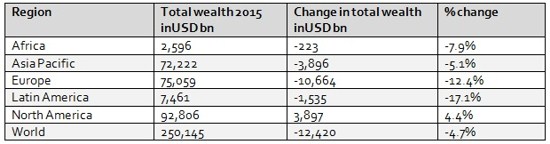
The regional breakdown shows that Europe was responsible for a loss of USD 10.7 trillion of the total household wealth, more than twice the USD 3.9 trillion loss in the Asia Pacific* region (including China and India). In percentage terms, Latin America experienced the highest percentage reduction among regions. It is also noteworthy that, in percentage terms, China is significantly ahead of North America (7.0% versus 4.4%), in part because the gains in the USA were offset by losses in Canada.
Table 1: Changes in total household wealth, mid-2014-2015, by region (see report for full table)
Interestingly, the losses recorded for the regions all vanish when currencies are valued at constant (average) exchange rates rather than the rates prevailing in mid-2014 and mid-2015. Figure 1 shows that Europe did almost as well as North America if exchange rates are held constant. In both Latin America and Africa, losses are transformed into small gains. The fact that the wealth declines observed last year depend so heavily on the prevailing exchange rate cautions against giving too much attention to the consequences of currency-related setbacks, which may well be reversed in the near future.
Figure 1: Change in total wealth (USD bn) by region, 2014-2015: current vs. constant exchange rates
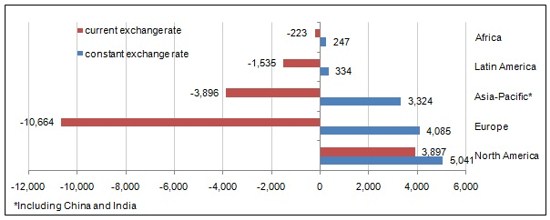
Source: James Davies, Rodrigo Lluberas and Anthony Shorrocks, Credit Suisse Global Wealth Databook 2015
Changes in Wealth from mid-2014 - 15: Middle East & North Africa
Household wealth in the MENA region totalled USD 4.4 trillion in mid-2015, down 2.2% since mid-2014. In constant currency terms, however, net wealth increased by 1.7%. Since 2000, the group of countries have increased their combined wealth by 147%, outpacing other regions such Africa and Asia Pacific. Interestingly, the growth rate in number of adults has outstripped that of all other regions over the same period, but the region did not lag behind in terms of wealth per adult growth. Since the turn of the century, average wealth per adult has grown by 62%, just below the global rate of 65%. Average wealth per adult in MENA declined by -6.9% to USD 15,800 in mid-2015, from 16,900 in mid-2014, although this decline is largely due to exchange rate weakness. Wealth per adult is currently some 22% below its peak in 2007, but in constant currency terms it is down just 5% from its peak.
Qatar recorded the highest average wealth per adult of USD 157,000 in mid 2015, growing 0.8% from the same period last year, while UAE followed closely with USD 144,400, but declined 0.3%from last year. Among major economies, Qatar occupied the 21st place globally in terms of average wealth, up from 29th place in the year 2000. Kuwait's wealth per adult amounted to USD 113,400 -a decline of 7.6% from last year. The average wealth per adult in Bahrain fell 0.3% from mid last year. Average wealth per adult in Saudi Arabia, the largest economy in the GCC, rose 0.9% from mid 2014 to reach USD 39,500, while Egypt's wealth per adult fell 5.3% to USD 7,000.
In terms of total wealth, Saudi Arabia ranked first among GCC economies, with an estimated total wealth of USD 0.7 trillion, closley followed by the UAE with an estimated wealth of USD 0.6 trillion. Egypt ranked first among North African nations with an estimated wealth of USD 0.4 trillion.
Top of the wealth pyramid
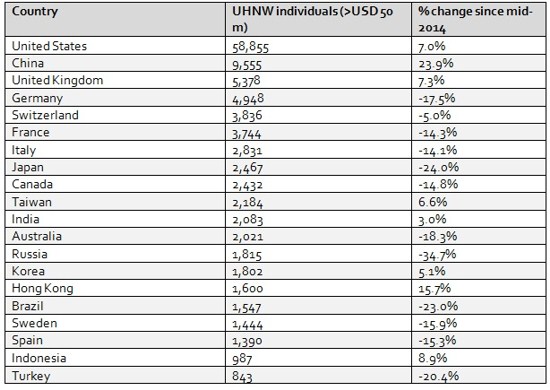
The Credit Suisse Research Institute estimates that there are 123,800 ultra-high net worth (UHNW) individuals worldwide, defined as those with a net worth exceeding USD 50 million. Of these, 44,900 are worth at least USD 100 million and 4,500 have assets above USD 500 million. The strong dollar has reduced the number of UNHW adults by 800 since mid-2014, but our calculations suggest that there has been a small increase in the number of individuals owning more than USD 500 million.
On a regional basis, North America dominates the regional rankings with 61,300 UHNW residents (50%), while Europe has 29,900 (24%) and 27,600 (22%) live in Asia Pacific countries (including China and India that are home to 9,600 and 2,100 UHNW individuals respectively). MENA countries have an estimated 2,300 UHNWI individuals.
Table 2: UHNW individuals 2015: Selected countries
Defining the Middle Class
We define the middle class in terms of a wealth band rather than an income range, corresponding to those with wealth between USD 50,000 and USD 500,000. A wealth-based definition, versus an income-based one, conforms better to the widespread view that middle-class membership is resilient to temporary setbacks. The bands are adjusted over time to reflect inflation, and also vary across countries depending on local purchasing power.
Middle-class wealth
The net worth of the middle class in 2015 amounted to USD 80.7 trillion worldwide, or 32% of global wealth. Adults with beyond the middle-class threshold accounted for a further USD 150 trillion, bringing the total wealth of the middle class and beyond to USD 231 trillion, or 92% of global wealth.
Trends in middle-class wealth
In all regions and in almost all countries, the wealth of the middle class and beyond has grown strongly this century. Globally, the wealth of those above the lower-middle-class threshold has more than doubled, from USD 108.3 trillion in 2000 to USD 230.9 trillion in 2015. In Africa, it has grown by 140% and in India by 280%, while China has experienced a six-fold increase.
Part of the increase reflects population growth and erosion of purchasing power by inflation. At the same time, after controlling for these factors there remains significant growth in the wealth of those above the middle-class cut-off.
Further inspection of the data yields two important observations. First, the increase in middle-class wealth occurred principally before the financial crisis. Second, the rise in wealth of the middle class and beyond has gone largely to those with wealth above our upper-middle-class threshold, despite the much smaller population size.
From 2008 onwards, wealth growth has not allowed middle-class numbers to keep pace with population growth in the developing world. Furthermore, the distribution of wealth gains has shifted in favor of those at higher wealth levels. These two factors have combined to produce a decline in the share of middle-class wealth (Figure 2).
Figure 2
Percentage of wealth owned by middle-class adults, 2000-2015, by region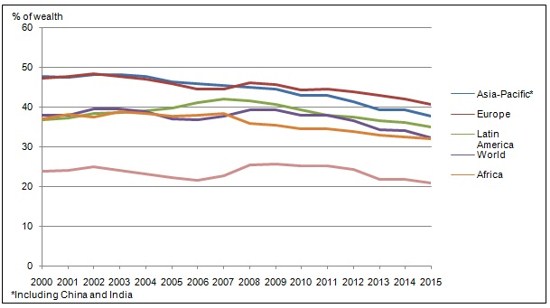
Source: James Davies, Rodrigo Lluberas and Anthony Shorrocks, Credit Suisse Global Wealth Databook 2015
Middle-class numbers by region and country
For each country, the upper limit of middle-class wealth is ten times the lower bound. This allows the members of the middle class to be identified, and their number and wealth to be estimated. Credit Suisse results indicate that 664 million adults belong to the global middle class in 2015, equivalent to 14% of the total adult population. A further 96 million (2% of world adults) have wealth above the upper bound of our middle-class wealth range.
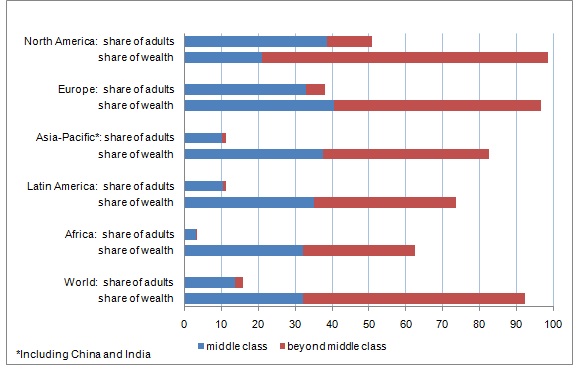
Across regions, the middle class is most prevalent in North America, where 39% of adults qualify, followed by Europe, where the proportion is one-third. As Figure 3 shows, the share then drops sharply to 10% for the Asia Pacific region (including China and India), around 11% in Latin America, and just 3% in Africa. Including those with wealth above the middle-class cut-off raises the North American incidence rate to 51%, but makes little difference to the numbers for Latin America or Africa.
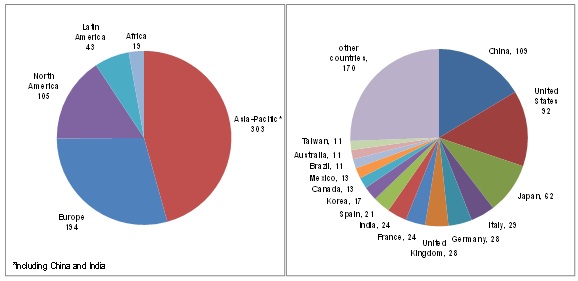
Despite a high incidence in North America, the region contains only 105 million middle-class adults (16% of the global total), significantly less than the 303 million members (46%) in the Asia Pacific region (109 million of whom are from China) or the 194 million residents of Europe (29% of the world). In fact, the number of middle-class adults in the USA has fallen below the number in China (see Figure 4). Adding those with wealth beyond our middle-class range raises the North American share from 16% to 18% and the region overtakes the number in China, but otherwise makes little difference to the regional ranking.
The middle class is so closely associated with North America - and with the USA in particular - that some of our results for individual countries may come as a surprise. The pattern displayed in Figure 4 shows that China now has the largest number of middle-class adults by a wide margin.
Figure 3: Share of middle-class adults and wealth, 2015, by region
Source: James Davies, Rodrigo Lluberas and Anthony Shorrocks, Credit Suisse Global Wealth Databook 2015
Figure 4: Number of middle-class adults (million), 2015, by region and country
Source: James Davies, Rodrigo Lluberas and Anthony Shorrocks, Credit Suisse Global Wealth Databook 2015
Wealth per adult across countries
The global average net worth figure of USD 52,400 per adult masks considerable variation across countries and regions. The richest nations, with wealth per adult over USD 100,000, are found in North America, Western Europe and among the rich Asia Pacific and Middle Eastern countries. This year there was more movement than usual among the country positions at the very top.
Table 3: Top ten countries with the highest average wealth per adult in mid-2015 (USD)

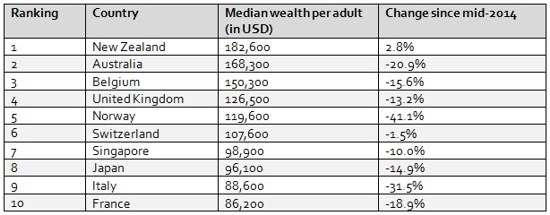
The ranking by median wealth per adult favors countries with lower levels of wealth inequality and produces a somewhat different ranking. On the basis of the revised data, we put New Zealand in second place in mid-2014 and conclude that this year its median wealth of USD 182,600 displaces Australia (USD 168,300) at the top of the list, where it had remained since 2008.
Table 4: Top ten countries with the highest median wealth per adult in mid-2015
The outlook for wealth
Wealth is set to continue its upward trajectory and could grow at an annual rate of 6.6% (including inflation), reaching USD 345 trillion in 2020. This is below last year's projection of 7%, but not outside historical norms. Between 2000 and 2007, wealth grew at a sizeable pace of 9.4%. Following the financial crisis of 2008, its pace has admittedly been tepid (just 4.4% annually), but this is in large part due to the strong dollar that has been appreciating at an annual pace of more than 1% versus other currencies (weighted according to wealth). To put this in context, wealth is currently at USD 250.1 trillion, 336% the projected global GDP for 2015 (which the IMF estimates at USD 74.6 trillion) and it could rise to 352% of GDP by 2020 (forecast at USD 98.1 trillion), approximately in line with its 15-year average of 349%.
The global economic outlook is weaker than previously expected, and this leads the Credit Suisse Research Institute to revise our projections downwards. The USA will remain the undisputed leader, with wealth nearing USD 113 trillion, but its share will decline somewhat to less than a third of the global total. Wealth growth in Europe will likely outpace the growth rate of the USA in the next five years, but the regional total will still fall short of the USA. It is noteworthy that the region exceeded the USA for a large part of the last 15 years, but fell behind following the strong US recovery during the post-crisis years. Among high-income countries, Switzerland will likely retain its spot as the world's number one in terms of wealth per adult, followed by New Zealand. Sweden could surprise by gaining the world's third spot. New Zealand and Australia will likely retain the top spots in terms of median wealth.
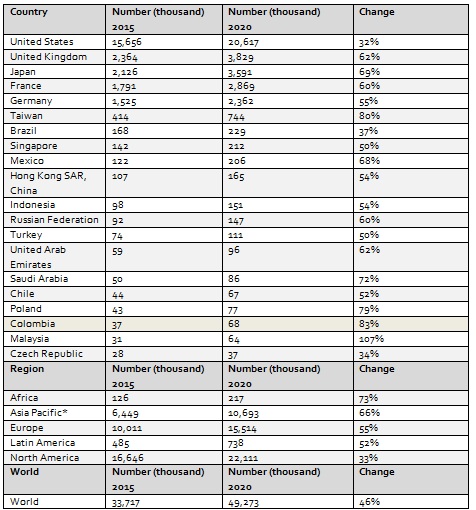
Estimates by the Credit Suisse Research Institute suggest that the number of dollar millionaires could exceed 49.3 million adults in 2020, a rise of more than 46.2%. Among the regions, China is likely to see the largest percentage increase, with the number of millionaires increasing by 74.0%. Africa will likely be the next performing region, with millionaires rising by 73.0%, albeit from a lower base. Overall, emerging markets (low- to middle-income economies) account for 6.5% of millionaires and will see their share rise to 7.4% by the end of the decade. High-income economies will still account for the bulk of new millionaires, with 14.0 million adults entering this category. Millionaire net wealth is likely to rise by 8.4% annually, as more people enter this segment. Emerging markets will likely account for 9.1% of millionaire wealth in 2020, 1% above current levels.
In the Middle East, Saudi Arabia and UAE are expected to see an increase in the number of dollar millionaires by 72% and 62% respectively, in the in the next five years. Overall, the MENA region numbered 330 thousand millionaires in 2015, up by more than 240% since 2000. The number of millionaires is projected to rise by another 52% to 500 thousand adults by 2020.
Table 5: Number of millionaires in 2015 and 2020 by regions, selected countries and world
*Including India and China
Notes to editors
· The report defines net worth or wealth as the value of financial assets plus real assets (mainly real estate) minus household debt.
· The figures presented in the report are based on the best available data on household assets and debts, estimated and updated where necessary.
· Data for 2015 and 2014 relate to mid-year values; the figures for earlier years indicate year-end values.
· Unless indicated otherwise, figures are expressed in nominal dollars and are not inflation adjusted.
· Full information on sources and methodology is provided in the Global Wealth Databook 2015.
· Projections to 2020 are made by the Credit Suisse Research Institute and are based on forecasts of the three components of wealth: financial assets, non-financial assets and debts.
To obtain a copy of the Credit Suisse Global Wealth Report 2015, please visit:
https://www.credit-suisse.com/researchinstitute.
Press Contact
Credit Suisse Media Relations, +41 844 33 88 44, media.relations@credit-suisse.com
Credit Suisse AG
Credit Suisse AG is one of the world's leading financial services providers and is part of the Credit Suisse group of companies (referred to here as 'Credit Suisse'). As an integrated bank, Credit Suisse offers clients its combined expertise in the areas of private banking, investment banking and asset management. Credit Suisse provides advisory services, comprehensive solutions and innovative products to companies, institutional clients and high-net-worth private clients globally, as well as to retail clients in Switzerland. Credit Suisse is headquartered in Zurich and operates in over 50 countries worldwide. The group employs approximately 46,600 people. The registered shares (CSGN) of Credit Suisse's parent company, Credit Suisse Group AG, are listed in Switzerland and, in the form of American Depositary Shares (CS), in New York. Further information about Credit Suisse can be found at www.credit-suisse.com.
Disclaimer
This document was produced by and the opinions expressed are those of Credit Suisse as of the date of writing and are subject to change. It has been prepared solely for information purposes and for the use of the recipient. It does not constitute an offer or an invitation by or on behalf of Credit Suisse to any person to buy or sell any security. Any reference to past performance is not necessarily a guide to the future. The information and analysis contained in this publication have been compiled or arrived at from sources believed to be reliable but Credit Suisse does not make any representation as to their accuracy or completeness and does not accept liability for any loss arising from the use hereof.
Appendix
(1) Biographies of the authors
Anthony Shorrocks is Director of Global Economic Perspectives Ltd. After receiving his PhD from the London School of Economics (LSE), he taught at the LSE until 1983, when he became Professor of Economics at Essex University, serving also as Head of Department and Director of Economic Research for the British Household Panel Study. In 2001, he was appointed Director of the World Institute for Development Economics Research of the United Nations University (UNU-WIDER) in Helsinki, where he remained until 2009. He has published widely on income and wealth distribution, inequality, poverty and mobility, and was elected a Fellow of the Econometric Society in 1996. Publications include "The age-wealth relationship: A cross section and cohort analysis" (Review of Economics and Statistics1975), "The portfolio composition of asset holdings in the United Kingdom" (Economic Journal 1982), and, with Jim Davies and others, "Assessing the quantitative importance of inheritance in the distribution of wealth" (Oxford Economic Papers 1978), "The distribution of wealth" (Handbook of Income Distribution 2000), "The world distribution of household wealth" in Personal Wealth from a Global Perspective (Oxford University Press 2008), "The global pattern of household wealth" (Journal of International Development 2009) and "The Level and Distribution of Global Household Wealth" (Economic Journal 2011).
Jim Davies is a Professor in the Department of Economics at the University of Western Ontario in Canada, where he has been a faculty member since 1977 and served as chair of the department from 1992 to 2001. He received his PhD from the London School of Economics in 1979. Jim was the director of the Economic Policy Research Institute at UWO from 2001 to 2012. In 2010, he completed a five-year term as managing editor of the academic journal Canadian Public Policy. From 2006 to 2008, he directed an international research program on household wealth holdings at UNU-WIDER in Helsinki and edited the resulting volume, "Personal Wealth from a Global Perspective" (Oxford University Press 2008). He has authored two books and over 70 articles and chapters in books on topics ranging from tax policy to household saving and the distribution of wealth. Publications include "The Relative Impact of Inheritance and Other Factors on Economic Inequality" (Quarterly Journal of Economics 1982), "Wealth and Economic Inequality" (Oxford Handbook of Economic Inequality, Oxford University Press, 2009), and several publications on wealth authored jointly with Anthony Shorrocks and others. Jim is also the editor of "The Economics of the Distribution
of Wealth," published earlier this year by Edward Elgar.
Rodrigo Lluberas is an analyst at the Research department of Uruguay Central Bank. He received his PhD in Economics from Royal Holloway College, University of London and his MSc in Economics from University College London. He has been a visiting scholar at the Institute for Fiscal Studies and
an Economist at Towers Watson in London. Prior to undertaking his MSc, he worked for three years as an economic analyst at Watson Wyatt Global Research Services and more recently as a research assistant at NESTA. His main areas of expertise are pensions, consumption and wealth.
(2) Scope and Methodology
The 2015 Credit Suisse Global Wealth Report (the report) and the more detailed accompanying Global Wealth Databook aim to provide the most comprehensive study of world wealth. Unlike other studies, they measure and analyze trends in wealth across nations, from the very bottom of the "wealth pyramid" to ultra-high net worth individuals.
This sixth Wealth Report continues our close collaboration with Professors Anthony Shorrocks and Jim Davies, recognized authorities on this topic, and the principal authors of "Personal Wealth from a
Global Perspective," Oxford University Press, 2008.
The Credit Suisse Global Wealth Report lays the foundation for a long-running examination by the Credit Suisse Research Institute of one of the crucial research areas in economics, and a vital driver of future megatrends. Moreover, it continues the thought leadership and proprietary research undertaken by the Research Institute over the past years.
Of note, China and India are treated as separate regions in the report due to the size of their populations. They are reported as part of Asia Pacific for this press release.
(3) The Credit Suisse Research Institute
The Credit Suisse Research Institute identifies and provides insights on global themes and trends. The objective of the Research Institute is to provide our clients with leading edge advice by leveraging internal and external expertise, thus reinforcing our integrated global bank approach.
The Institute was established in December 2008 to conduct research on new emerging or influential topics, working with some of the world's most distinguished experts, academics and institutions and Credit Suisse's global network of internal analysts, and makes this available throughout the Bank for the business units to create innovative products, solutions and services for Credit Suisse's clients.
Clients increasingly require global reach, local expertise and competitive products and services from the financial services industry. The Institute's investigations are conducted to furnish clients across divisions and regions with an in-depth analysis of fundamental social, economic, scientific, environmental and demographic trends that are expected to impact global markets in the future.
The Research Institute is chaired by the Chairman of the Board of Credit Suisse, Urs Rohner, and managed by an Operating Committee from Credit Suisse's research units from across the Bank. The Institute draws on eminent Senior Advisors as well as selected Credit Suisse researchers to provide advice, insight and guidance on global themes and trends for the Institute's research agenda. The Institute's Senior Advisors are characterized by their interdisciplinary backgrounds and networks across sciences, academia, business and the political arenas. They include Walter B. Kielholz, The Rt. Hon. Sir John Major, KH, CH, Prof. Laura D. Tyson, and Dr. Ernesto Zedillo. For more information, visit: https://www.credit-suisse.com/researchinstitute.
* Wealth data for Asia Pacific in this press release include China and India.
© Press Release 2015