PHOTO
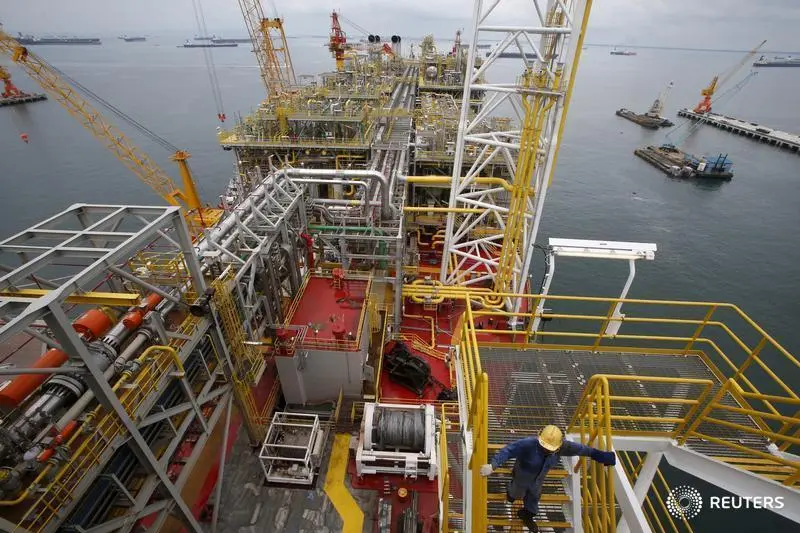
Singapore's marine fuel sales, also known as bunker sales, rose to a three-month high in October as both vessel calls and container throughput grew, official data showed on Tuesday. Sales in October totalled 4.401 million metric tons, up 3.2% from the prior month and 3.5% higher year-on-year, latest data from the Maritime and Port Authority (MPA) showed.
Bunker sales in Singapore are a key indicator of sentiment at the world's largest ship refuelling hub, which is also one of the busiest shipping lanes globally. Singapore's container throughput was 1.1% higher from September's levels, at 3,241,200 twenty-foot equivalent units in October. The number of vessel calls for bunkering stood at 3,206 last month. Low-sulphur fuel oil (LSFO) sales for bunkering totalled 2.52 million tons in October, up 2.7% from September, while high-sulphur marine fuel oil (MFO) sales were at 1.45 million tons in October, down 1.5% from the prior month. ALTERNATIVE FUELS Sales of bio-blended LSFO rose to 76,800 tons in October, the highest monthly level since MPA records started in 2022.
The total bio-blended LSFO sales were at 401,260 tons in the first 10 months this year, the data showed. October bunker sales of liquefied natural gas (LNG) reached a three-month high of 16,100 tons, more than double from September.
Overall LNG sales for the first 10 months hit 94,480 tons. Singapore monthly bunker sales by grade in '000 tons: Total MGO LSMGO MFO Bio-blend LSFO Bio-blende LNG Methanol ed MFO d LSFO Jan-22 4,029.0 13.8 335.9 1,122.4 0.0 2,555.9 1.0 0.0 0.0 Feb-22 3,506.8 10.6 280.5 924.1 0.0 2,276.4 12.5 2.7 0.0 Mar-22 3,769.9 9.7 272.0 1,091.2 0.0 2,393.5 3.3 0.2 0.0 Apr-22 3,750.0 7.9 278.9 978.5 0.0 2,475.1 9.2 0.4 0.0 May-22 4,044.0 5.8 300.9 1,094.8 0.0 2,637.3 4.4 0.8 0.0 Jun-22 3,756.0 6.9 272.4 1,121.0 0.0 2,345.4 8.2 2.1 0.0 Jul-22 4,119.2 13.8 313.8 1,287.6 0.0 2,499.3 3.2 1.6 0.0 Aug-22 4,116.3 11.3 330.4 1,263.0 0.0 2,498.2 13.4 0.0 0.0 Sep-22 3,959.5 6.3 329.4 1,158.3 0.0 2,444.7 19.8 1.0 0.0 Oct-22 4,252.8 11.1 305.1 1,348.5 0.0 2,564.9 21.5 1.7 0.0 Nov-22 4,375.6 22.8 307.8 1,290.3 0.0 2,728.6 23.1 2.9 0.0 Dec-22 4,217.8 20.6 285.6 1,312.4 0.0 2,575.7 20.6 2.9 0.0 Jan-23 4,378.3 10.8 313.7 1,251.1 0.0 2,774.1 27.2 1.4 0.0 Feb-23 3,795.9 6.2 297.0 1,142.7 0.0 2,320.0 28.5 1.6 0.0 Mar-23 4,179.0 14.7 315.5 1,268.0 0.0 2,549.2 27.9 3.7 0.0 Apr-23 4,258.8 15.3 312.2 1,218.4 1.3 2,669.3 37.0 5.2 0.0 May-23 4,525.3 27.5 312.9 1,445.2 0.5 2,697.6 34.6 7.1 0.0 Jun-23 3,932.9 12.0 271.5 1,237.5 1.0 2,358.8 34.3 17.9 0.0 Jul-23 4,517.5 22.3 287.6 1,484.0 0.5 2,665.2 39.4 18.3 0.3 Aug-23 4,255.1 8.1 274.5 1,393.0 0.0 2,511.4 52.6 15.6 0.0 Sep-23 4,263.6 20.4 265.0 1,472.7 0.0 2,454.9 43.0 7.7 0.0 Oct-23 * 4,401.5 35.7 297.8 1,451.2 0.0 2,521.7 76.8 16.1 0.0 (Data from Maritime and Port Authority of Singapore) (Figures are based on latest available data at the time of publishing, and may be subject to revision at a later date, based on MPA.) (Reporting by Ashley Fang; Editing by Sonia Cheema)