PHOTO
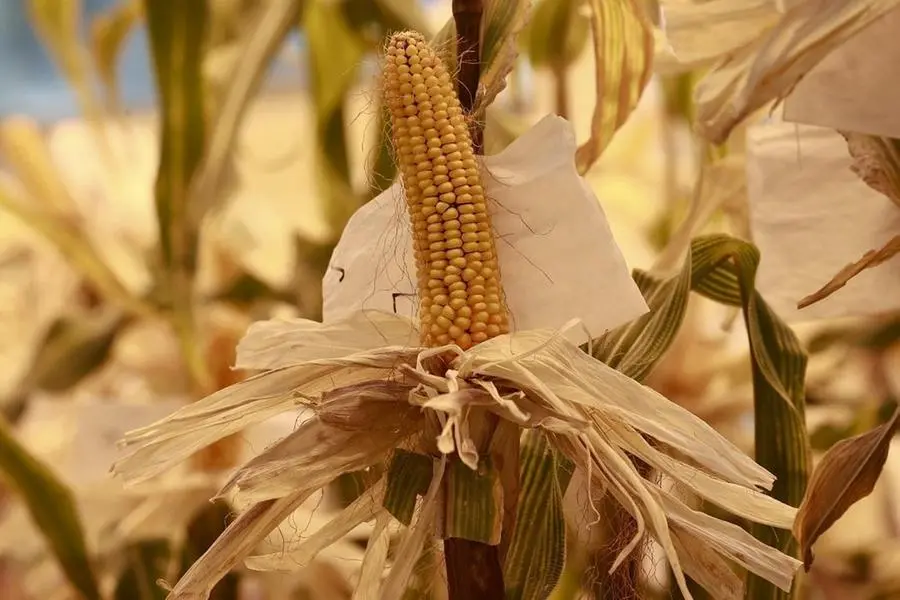
NAPERVILLE, Illinois - Global corn stockpiles are set to reach five-year highs later in 2024, undergoing their largest annual expansion in seven years. But the United States’ contribution to that growth is much larger than normal after a record harvest last summer.
That would usually spur a bit more U.S. demand than is currently projected for 2023-24, though ample supplies in rival exporters have cut into U.S. market dominance, suggesting last year’s huge U.S. corn acreage was excessive.
However, this anomaly should correct in 2024-25, which starts Sept. 1 for the United States.
U.S. Department of Agriculture estimates suggest 2023-24 global corn ending stocks will rise 7% on the year, but U.S. stocks are set for a 60% surge. That is the most lopsided, U.S.-heavy growth since 2004-05, when U.S. corn supplies exploded by 120% and global ones rose a more modest 25%.
Overproduction of U.S. corn in 2004 and 2023 is the most logical explanation, because excluding U.S. supplies, global corn stocks in 2004-05 fell more than 3%, and they are seen rising fractionally in 2023-24.
The only other recent outlier in global versus U.S. corn stocks is 2012-13, when a historic U.S. drought sent domestic corn ending stocks 17% lower on the year. However, global corn carryout rose 17% that year after nearly two years of record high prices stimulated production growth in other corn exporting countries.
USDA tentatively expects 2024-25 U.S. corn ending stocks will hit 37-year highs and rise another 17% from this year, even with a smaller crop. But at that rate, global corn stocks in 2024-25 could be flat on the year and still align with “normal” trends, so a second straight anomalous year for U.S. stockpiles is unlikely.
19 YEARS APART
There are similarities between 2004-05 and 2023-24, especially when it comes to production. In 2004, U.S. corn plantings rose by 3% to a 19-year high of 80.9 million acres. Last year’s acres were a 10-year high of 94.6 million, up 7% from 2022.
The biggest factor in 2004 was the earth-shattering yield of 160.3 bushels per acre, some 18.1 bpa above the previous high set the year before. USDA’s trend line yield was 145 bpa that year, which would have also secured a record.
The 2023 yield of 177.3 bpa was also a record, topping the prior high of 176.7 from 2021. But USDA’s initial 2023 trend yield was 181.5, so last year’s record was significantly less impressive than in 2004.
Corn use for ethanol is the biggest difference between the current and 2004-05 balance sheets, as the latter was just before establishment of the Renewable Fuel Standard (RFS) that mandated corn-based ethanol blending in the U.S. fuel supply.
Ethanol production accounted for 12% of total U.S. corn use in 2004-05 compared with 37% today. The export share of 14% in 2023-24 compares with 17% in 2004-05, and total corn use is more than a third higher today.
That major shift in domestic corn use is why many analysts start from 2007 when evaluating potential corn supply and especially demand outcomes, meaning there are no post-RFS scenarios with which to compare the current situation.
The United States accounted for more than 60% of global corn exports in the mid-2000s and Brazil averaged about 6%. They are both slated for shares around 27% in 2023-24.
U.S. corn prices began 2005 at multi-year lows then underwent a typical summer rally that peaked in mid-July. Prices faded back to lower levels to finish out 2005, and it was not until September 2006 that corn began its upward shift into the RFS-era prices.
Most-active Chicago corn futures last displayed a $2-per-bushel handle on Oct. 13, 2006. Karen Braun is a market analyst for Reuters. Views expressed above are her own.
(Editing by Kirsten Donovan)