PHOTO
(The opinions expressed here are those of the author, a market analyst for Reuters.)
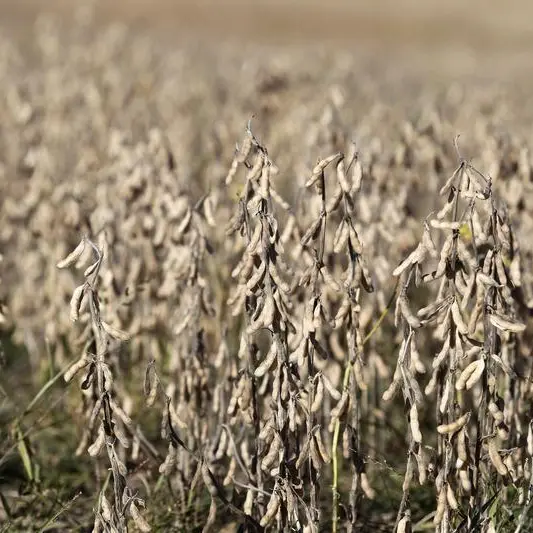
NAPERVILLE, Ill. - U.S. corn and soybean yields are always a leading topic among market analysts each year, but the possibilities are still wide open before the crops are fully planted.
That sometimes creates confusion over the meaning of early U.S. government yield projections, which for corn have recently been running on the high side, while those for soybeans have been more modest in the context of past results.
But what do the trendline yields represent, and are they a good precursor to actual yield potential? The latter could be debated, though there are some identifiable patterns worth studying.
The U.S. Department of Agriculture publishes its first official supply and demand outlook for the new marketing year each May, and this year’s is due on Thursday. The U.S. corn and soybean yields come from a trend yield formula computed by USDA’s World Agricultural Outlook Board.
The corn yield calculation assumes normal mid-May planting progress and focuses on July weather, with an adjustment for excessively dry Junes. The soybean model uses July and August weather variables and does not use planting progress.
The corn planting progress assessment is aligned with May 15, but the latest data is through May 8. So even though this year’s planting is very delayed thus far, that should not warrant a yield tweak on Thursday. Planting was also late in 2019, and trend yield was not impacted until the June report.
The same trend yield model carries into the June and July outlooks, but USDA’s National Agricultural Statistics Service takes over the yield estimation in August with survey-based data, and then field observations are incorporated a month later.
The trend corn yield USDA prints on Thursday is likely to be 181 bushels per acre (bpa), equivalent to its unofficial outlook from February. The May and February corn yield have been the same every year since 2014. May and February soybean yields have long been identical, which for 2022 should be 51.5 bpa.
But is a 181 bpa corn yield truly representative of the U.S. trend? Some analysts would argue no since the record is well short of that. However, records have previously been predicted, then broken, although it is not the most common scenario.
IN THE WEEDS
In each year from 2013 through 2018, final U.S. corn yield exceeded USDA’s trend yield, leading some to wonder if the trend calculation lagged reality. But yield has yet to reach the trends computed for 2020, 2021 and 2022, and the assumed record margin keeps expanding.
A 181-bpa trend for 2022 would be 4 bpa above the record observed yield, the largest such jump within the last three decades, and the same stat is true percentagewise. Last year had been the prior largest as the trend yield of 179.5 bpa was 2.9 bpa above anything ever witnessed.
USDA’s trend corn yield has been the highest one ever computed in every year since 2015, though actual U.S. yields have set new highs in only three of those eight years.
Last year was the first since 2014 where USDA’s trend predicted a new record and a record was in fact set, but 2014 was different in that the final yield was higher than the trend.
If final 2022 yield meets or exceeds 181 bpa, it will be the first time since 2004 that all the following conditions were satisfied: yield is record, yield is equal to or larger than USDA’s trend yield, the trend had predicted a new record and the trend was the largest one ever projected.
Those conditions were also met in 2003, the only other instance since at least 1993, and those four boxes were checked for soybeans only once: 2014. They already cannot be satisfied for soy in 2022 if trend stays at 51.5 bpa since that is lower than 2016’s record of 51.9.
USDA’s trend soybean yield has been the highest one ever projected in every year since 2006, but the figures themselves have been more conservative relative to corn. In the last 29 years, the trend soy yield represented a new record only twice: 2013 and 2014.
However, there may be support for a slightly more aggressive trend. Final U.S. soybean yield has been above USDA’s trend in seven of the last eight years, the only failure coming in 2019 after record planting delays.
But record soybean yields have been elusive lately. Five seasons have now passed without a new high, though records had been set in each of the four previous years. The five-year record-less streak is the largest since the 1995-2003 run, ending when 2004’s yield edged 1994’s by less than 1 bpa.
Part of the recent weight on soybean yields is a string of poor weather seasons in North Dakota, which planted 8.3% of the U.S. soybean acres last year but ended up with the worst yield in 17 years because of drought.
Karen Braun is a market analyst for Reuters. Views expressed above are her own.
(Editing by Matthew Lewis)
