This is the time when all the Wall Street houses come out with their yearly predictions for the markets. It's also the time when Wealth Daily does the same.
Recently, I came out with Wealth Daily's oil forecast. I said oil would hit $125 a barrel. Whether or not it ends the year at that level, I don't know. But at some point in 2012, I believe oil will hit $125 based on the technical pattern I'm seeing in the oil chart. And that will be the high for the year. Interestingly enough, the pattern I'm seeing in oil is the same chart pattern I'm seeing in gold.
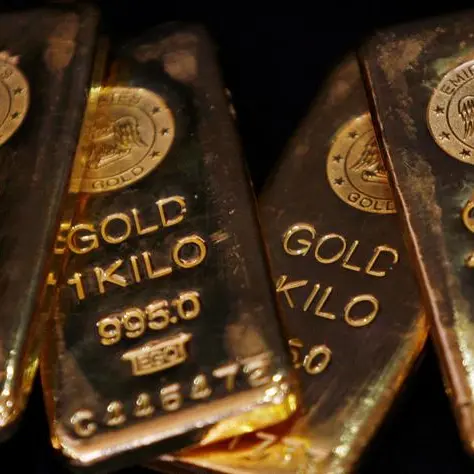
Morgan Stanley is predicting gold will be the best-performing commodity in 2012 and may make a new record high as investors look to secure their wealth against European uncertainty and slowing economic growth. Their price target is $2,200 an ounce... with the potential to reach as high as $2,464.
Goldman Sachs is less aggressive, but bullish nonetheless. Their price target for gold in this year is $1,940 an ounce.
We're staying overweight on commodities as a rebound in demand revives speculation of shortages, with gold a favorite for 2012 as investors seek a hedge against Europe's debt crisis.
Demand for gold strengthened most of last year as Europe's debt crisis widened and the U.S. Federal Reserve pledged to keep interest rates near zero until at least mid-2013. Low interest rates increase the appeal of bullion because they generally reduce the prospect of returns on bonds.
Our view on gold is driven by our view on underlying real interest rates. It is the sharp drop in price that makes it more attractive. One of the things I do to gauge the gold market is I go to coin and bullion dealers.
Hong Kong recently reported that their gold imports reached record heights as investors rushed to the precious metal before the Luna New Year in order to "hedge against financial turmoil."
According to Bloomberg: Demand for gold is climbing in China as investors seek to protect their wealth against slumping property prices and equity markets amid an inflation rate above 4 percent. The nation overtook India in the third quarter as the largest gold jewelry market, according to the World Gold Council.
I usually read Wall Street predictions with a skeptical and suspicious eye. But I actually think they're spot-on with their call especially after reading the Chinese story.
And the chart of gold suggests they're right.
Gold is setting up a double-bottom formation after selling off late last year.
You see, this pattern formed before in 2008-2009.
In fact, it's almost the exact same formation:
Gold broke out perfectly from the "W" formation... and hit the precise price target is was supposed to hit.
The current chart suggests a breakout to $1,950 almost exactly what Goldman is predicting.
I've been long gold for several years. I'm still long this year.
About the Author
Brian Hicks is a founding member and President of Angel Publishing. He writes about general investment strategies for Wealth Daily, Energy & Capital and the H & L Market Report. Known as the "original bull on America," Brian is also the author of the 2008 book, Profit from the Peak: The End of Oil and the Greatest Investment Event of the Century. In addition to writing about the economy, investments and politics, Brian is also a frequent guest on CNBC, Bloomberg, Fox and countless radio shows.
© Capital ME 2012